Administration
Dashboards, Reports & AI Assistant
Every app has a dashboard; the hospital dashboard brings the day together — visits, admissions, occupancy, theatre, revenue, collections, claims, incidents. Pivot and graph views on every list answer the next question; the AI assistant answers in words from the same data.
For:DirectorsDepartment headsFinance
Where:Dashboards · any list › pivot / graph · AI Assistant
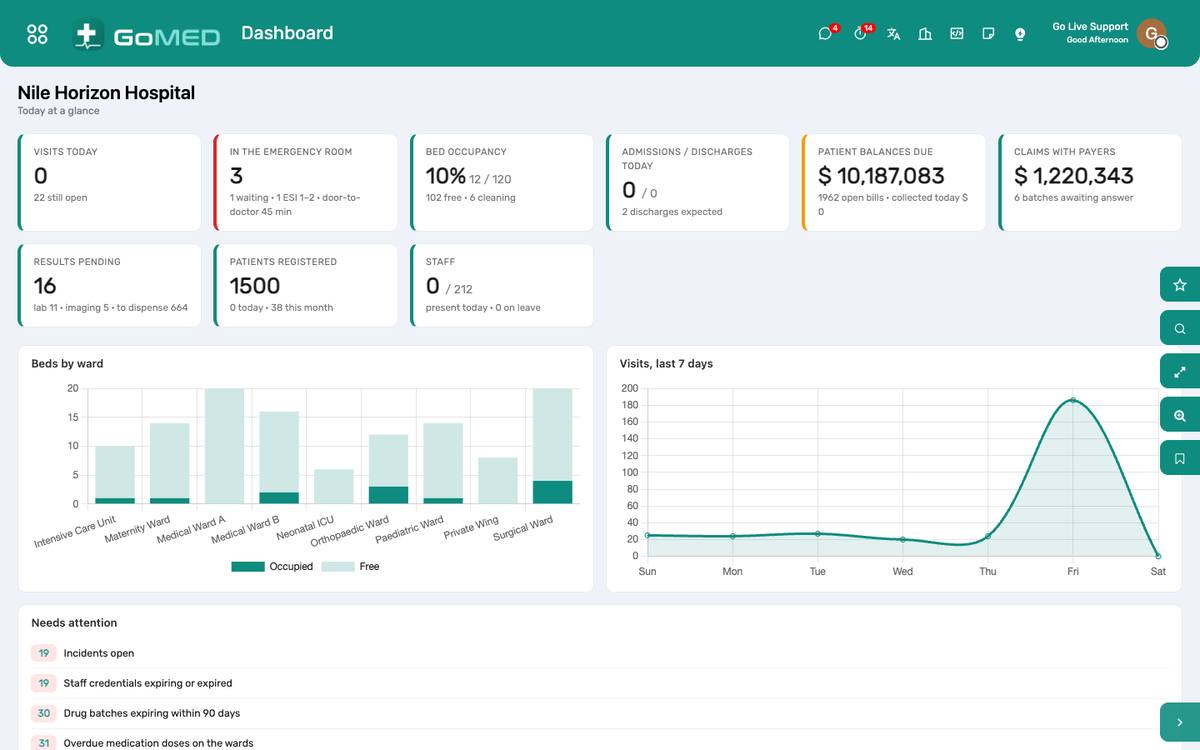
The hospital dashboard.
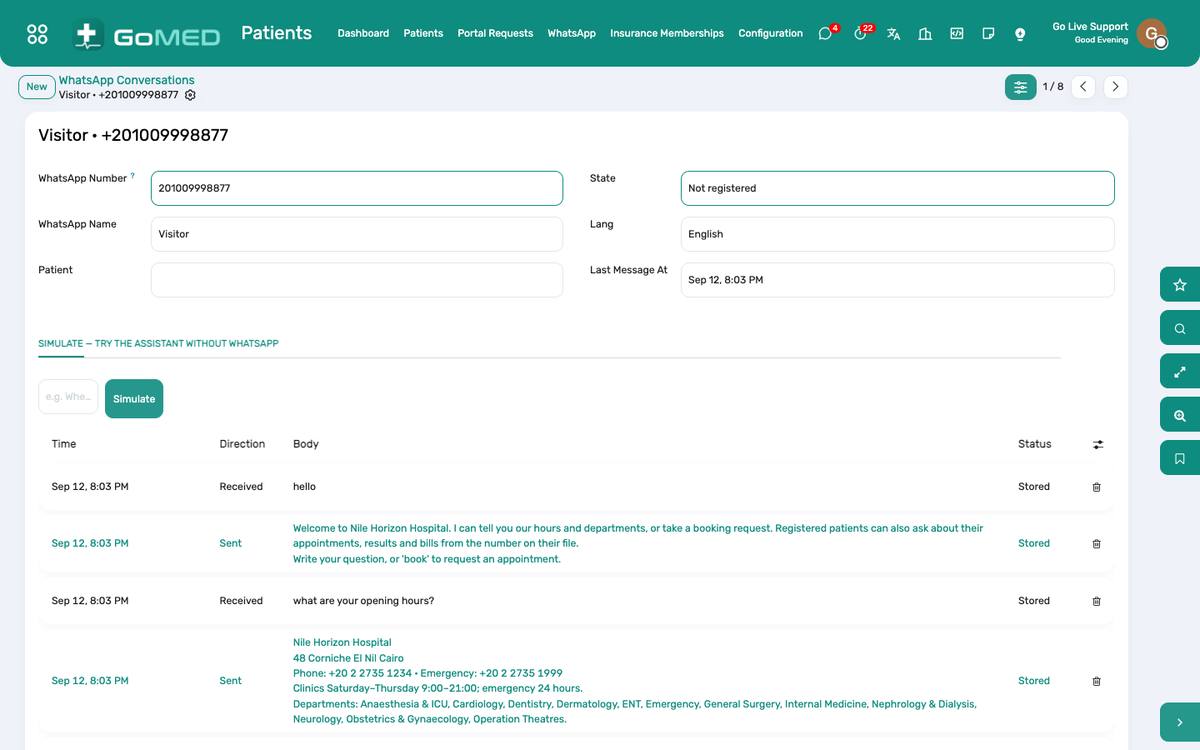
The AI assistant answering from the hospital’s own records.
How to
Read the hospital dashboard
- Dashboards › Hospital: the numbers of the day, the charts of the fortnight and the lists that need attention; every card opens its list.
- Change the period with the filter; compare departments with the group-by.
Build a report from a list
- On any list switch to Pivot: choose rows, columns and measures (count, amounts); expand headers; download to Excel.
- Graph: bar, line or pie of the same; Favourites › Save as dashboard to keep it.
Ask the AI assistant
- AI Assistant › New conversation: “How many admissions last month by ward?”, “Which claims are rejected and why?”; the answer cites the records and opens them.
- It reads only what your role can read.
See also: Signing in and finding your way Bills, Charges & Cashier